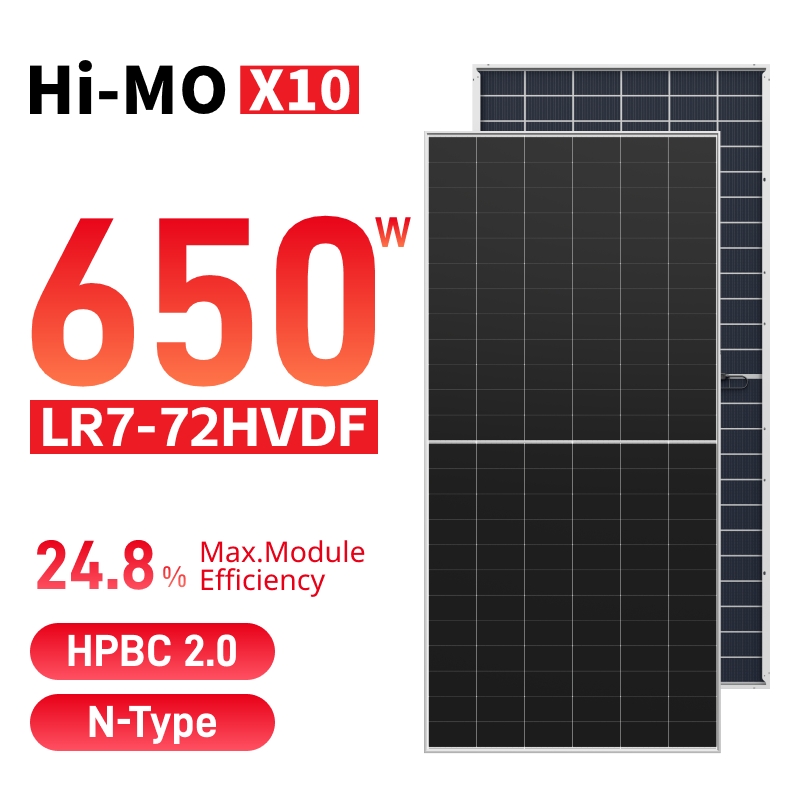
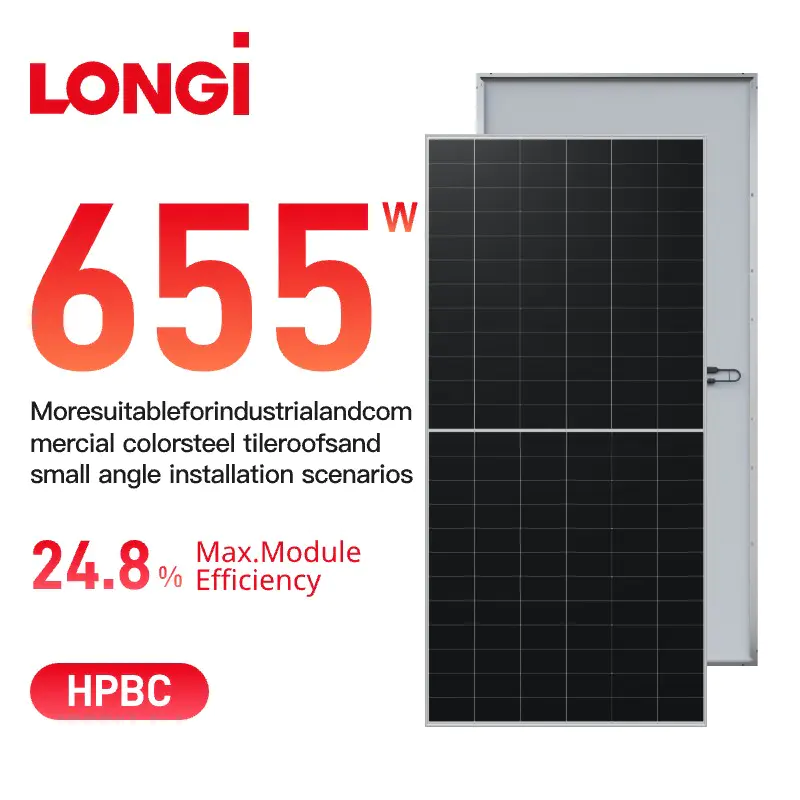
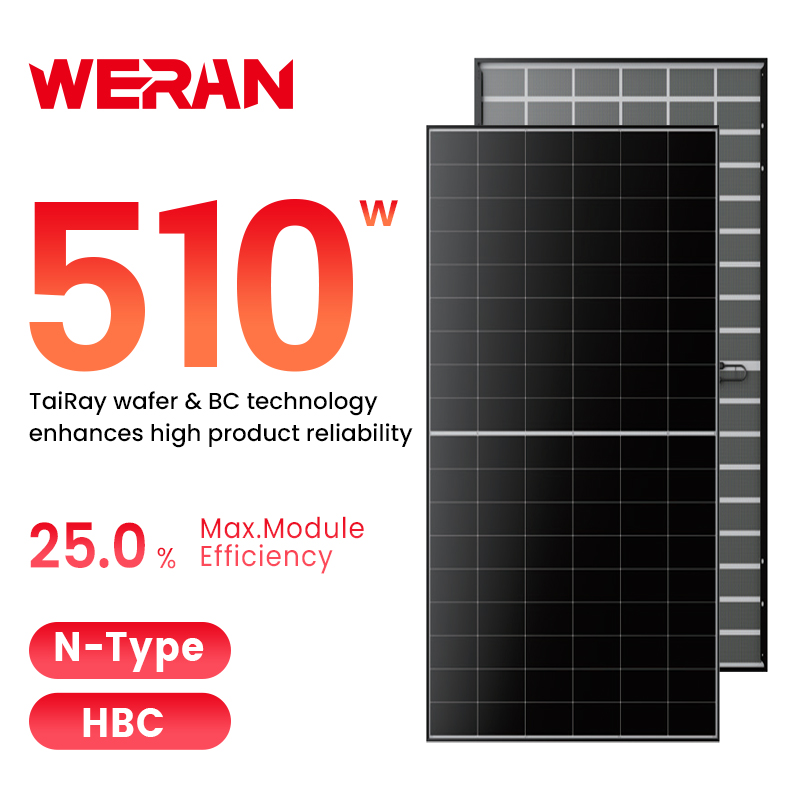
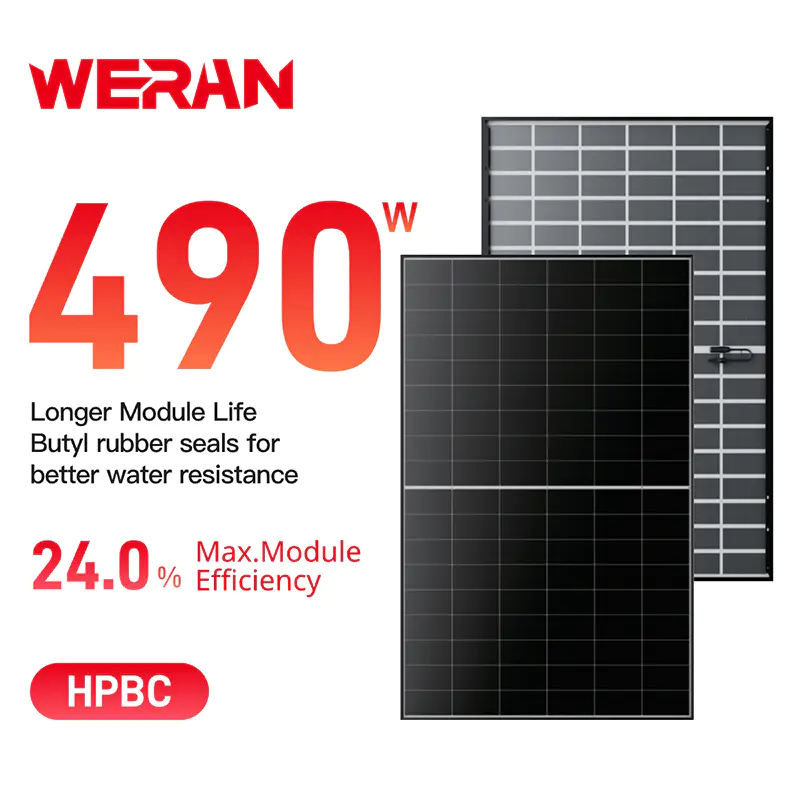
Conventional crystalline silicon panels place metal grid lines on the front surface of the cell to collect current. That grid blocks a portion of incoming sunlight, and every busbar or finger printed across the glass side represents lost photons that never reach the silicon. HPBC 2.0, a heterojunction-passivated back contact solar module technology, moves the entire electrode structure to the rear of the cell.
This is not a cosmetic change. Removing front-side metallization eliminates the shading losses that typically account for a measurable share of a panel theoretical output. Combined with a refined passivation stack, the result is a cell architecture that starts from a higher efficiency ceiling before any downstream engineering even begins.
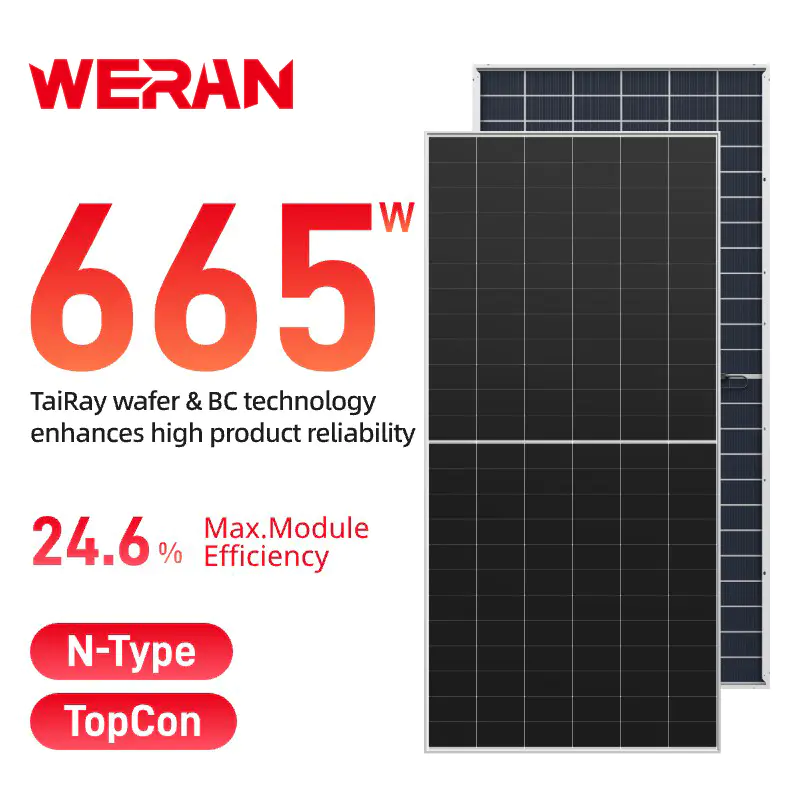
24.6%Max module efficiency
N-TypeCell base material
01
Why Back Contact Design Reduces Shading and Resistive Losses
Efficiency gains in an hpbc 2.0 solar module come from two compounding effects. First, the absence of front busbars recovers light that would otherwise be reflected or absorbed by metal. Second, because contacts sit on the rear, cell design can widen and multiply narrow-width collecting fingers without creating shade on the front collection surface.
Lower resistance also means the cell runs cooler under equivalent load, which further stabilizes output. Benchmarked against mainstream cell technologies under standard test conditions, the efficiency gap becomes clear.
An efficiency improvement of roughly one to two percentage points over TOPCon and PERC alternatives may look small in isolation, but across a 25-year service life on a fixed roof area, it compounds into a meaningfully larger total energy harvest, particularly where roof space is the binding constraint rather than budget.
02
Thermal Behavior and Power Retention Under Heat Stress
Rooftop modules routinely operate well above the 25 degree Celsius rating condition used in datasheets, especially on dark composite shingles or low-slope commercial membranes where cell temperatures can climb past 55 or even 65 degrees Celsius during peak summer hours.
Every silicon cell loses output as temperature rises, but the rate of loss varies. The HPBC 2.0 cell architecture is less affected, delivering more effectively than standard back surface field designs, which flattens the output curve as heat increases.
The practical effect shows up most on hot climate installations and dark roofing materials, where a flatter thermal curve means the panel keeps delivering closer to its rated capacity precisely during the summer afternoon hours when electricity demand and grid pricing are typically highest.
03
Long-Term Degradation and Cumulative Energy Yield
Annual degradation rate determines how much of a panel original output survives after two or a half decades of ultraviolet exposure, thermal cycling, and humidity ingress. Lower first-year degradation combined with a slower linear decline thereafter results in a meaningfully larger area under the production curve over the life of the system, even when starting efficiency is held constant.
Over a full 25 year contract or ownership period, the widening gap between standard PERC decline curves and HPBC 2.0 decline curves means the incremental energy advantage does not stay fixed at the first-year figure. It grows year over year, which is a critical variable for financial modeling on power purchase agreements and lease structures where revenue is tied directly to metered output.
04
Visual and Structural Advantages for Rooftop Integration
Because the front surface carries no visible busbars or grid lines, HPBC 2.0 modules present a uniform, all-black appearance that architects and homeowners increasingly specify for street-facing roof planes.
This is not purely cosmetic on commercial projects either, since uniform color reduces glare inconsistency across large arrays and simplifies visual inspection during maintenance, letting any hotspot or micro-crack tend to stand out more clearly against a clean background.
05
From Wafer to Module: The HPBC 2.0 Manufacturing Flow
Producing a back-contact cell requires tighter process control than a standard front-contact line, since both polarity contacts must be precisely aligned on the same rear surface without shorting. The simplified sequence below outlines the core stages.
Electroluminescence testing after contact patterning is particularly important for back-contact designs, since micro-shorts between adjacent interdigitated fingers are not visible to the naked eye but can measurably affect fill factor. Suppliers with mature HPBC 2.0 lines typically run full inspection rather than statistical sampling, which reduces the risk of early field failure reaching installed systems.
06
Comparing Total Cost of Ownership: Residential vs Commercial Deployment
Return on investment depends on more than panel price per watt. Installation labor, inverter sizing, roof area available, and long-term yield all factor into the final calculation. The table below summarizes how HPBC 2.0 characteristics typically influence project economics across the two most common deployment scenarios.
Factor
Residential rooftop
Commercial rooftop
Available roof area
Often limited by roof shape
Large but sometimes shading-affected
Value of higher efficiency
High, since area is fixed
High for capacity-constrained sites
Value of visual uniformity
High for street-facing homes
Moderate to high for visible facades
Sensitivity to thermal derating
Moderate
High on dark low-slope membranes
Impact of slower degradation
Improves long-term savings
Improves lease and revenue agreements
In both settings, the shared thread is that HPBC 2.0 economics improve most where the physical constraint is roof area rather than budget, and where the operating environment includes meaningful heat exposure, which is worth factoring into any project-specific payback calculation.
07
What to Evaluate When Choosing an HPBC 2.0 Solar Panel Supplier
Not every panel labeled as back-contact or N-type delivers the same real-world performance, since cell architecture, passivation quality, and encapsulation materials all vary by production line. Buyers should ask for third-party verified performance data rather than relying on datasheet claims alone, particularly around temperature coefficient and warranty degradation curves.
It is also worth reviewing how a supplier validates its modules before shipment, including electroluminescence pass rates, hot-spot testing under partial shading, and mechanical load testing for snow and wind conditions relevant to the installation region. For commercial buyers, bankability documentation and consistent module-to-module output tolerance matter as much as the headline efficiency figure, since large arrays amplify the financial impact of a weak outlier.
Finally, warranty structure deserves close reading. A meaningful performance warranty should specify guaranteed output at multiple points across the 25 year term rather than a single end-of-life figure, since that structure gives a clearer picture of how the degradation curve is expected to behave in practice.
08
Frequently Asked Questions
Q1: What efficiency gains can I expect from standard TOPCon panels?
Mainstream N-type TOPCon modules typically reach the low-22 percent module efficiency range, while HPBC 2.0 designs push into the mid-24 percent range by eliminating front-side shading losses entirely.
Q2: Are HPBC 2.0 panels more expensive than standard modules?
Back-contact cells carry higher manufacturing complexity due to tighter rear-contact alignment tolerances, which can translate into a modest cost premium over standard front-contact modules of similar wattage class.
Q3: Is HPBC 2.0 technology more prone to micro-cracks or reliability issues?
The front surface has no metal-to-silicon junctions to protect, which can reduce certain front-side failure modes, though rear-side interconnection reliability still needs careful engineering since all electrical connections are concentrated on one surface.
Q4: How does HPBC 2.0 perform in high-humidity or coastal environments?
Performance in humid and coastal conditions depends heavily on encapsulation and passivation quality rather than the back-contact architecture alone, so third-party damp-heat and salt-mist test results are worth requesting directly from the supplier.
 English
 Français
 Español
 عربى
عربى Український